Trading analytics
Your numbers, sliced the way you trade.
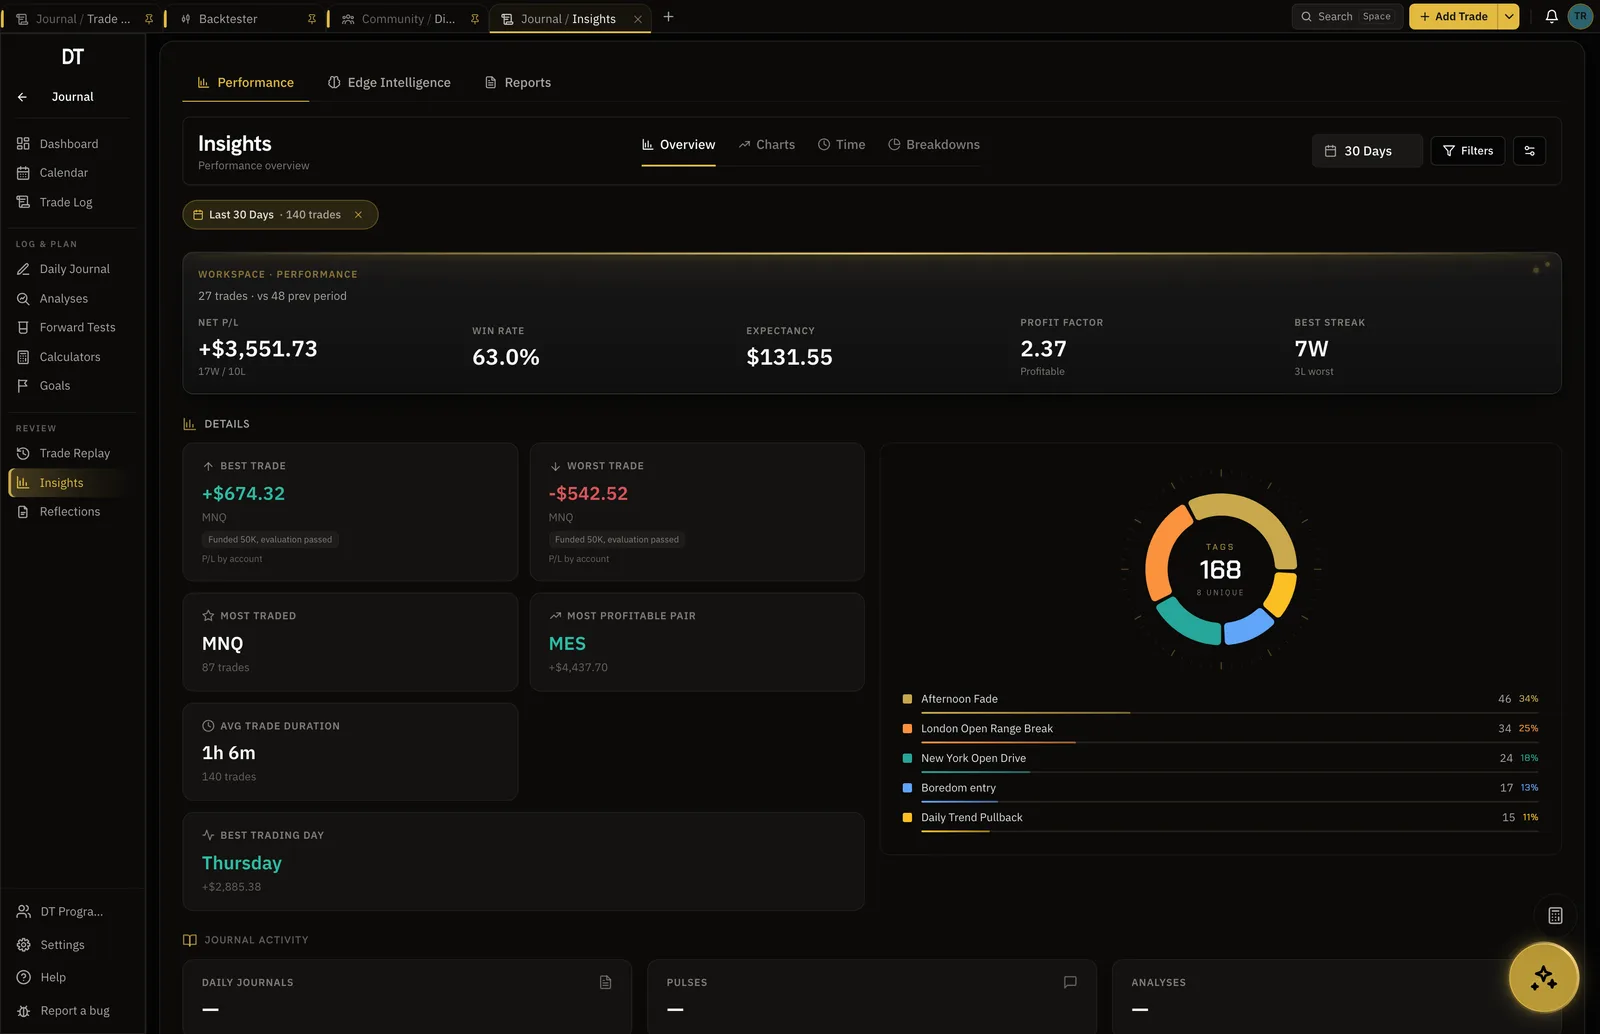
Insights read the record you already keep. Filter it by account, tag or strategy, compare trades side by side, and test stops and targets against your own history.
- Free
- Basic insights on every account
- Up to 4
- Trades compared at once
- 0 to 100
- Execution score on a compared trade
- $18
- Pro, per month
How it works
- 01
Keep the record
Type trades in, import a CSV, or sync a broker on Pro so every fill arrives on its own.
- 02
Slice it
Date range and instrument are free. Account, tag and strategy filters are Pro, and the numbers recompute as you change them.
- 03
Test the change
The exit optimiser prices a different stop or target against your history, and the backtester tests the rule before it costs you.
Per account
Each account keeps its own numbers.
Evaluation, funded and personal accounts are scored separately, so one good month somewhere else cannot flatter the account you are trying to fix.
- Outliers with the account named
- Up to three linked broker accounts on Pro
- Compare two accounts or two months
Pattern recognition
Compare the trade you took with the one you should have.
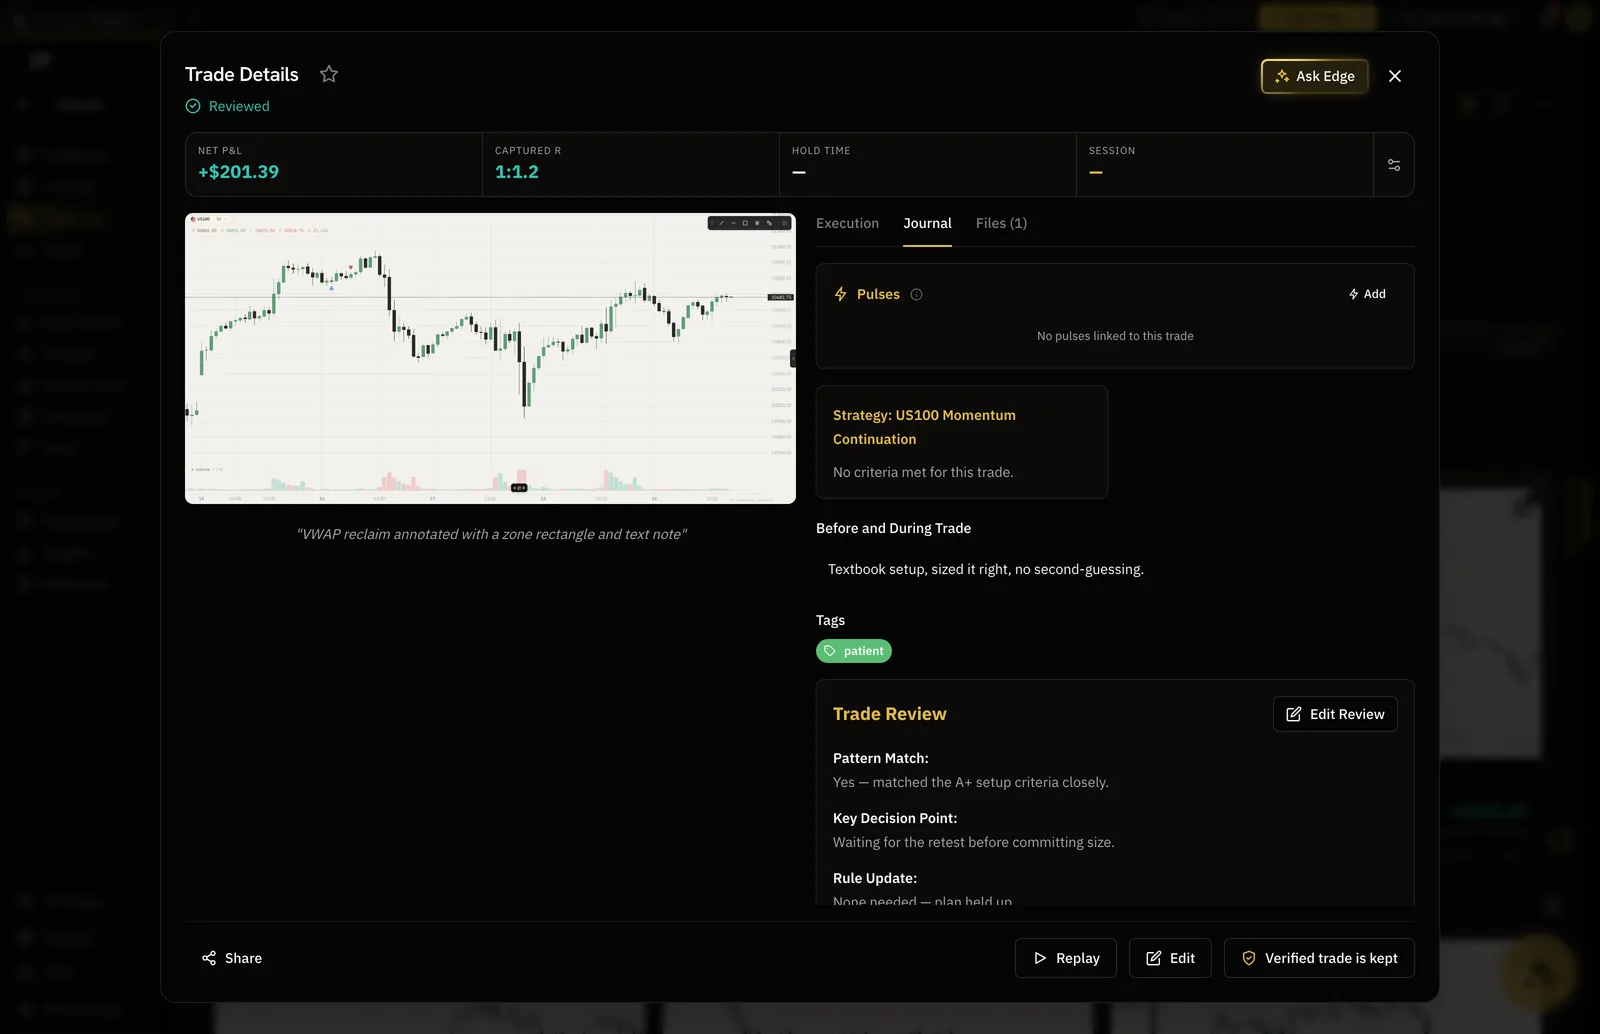
Put up to four trades side by side and each gets an execution score out of 100 for stop adherence, risk discipline and exit quality, with the behaviour named.
- Revenge trades and risk escalation, flagged
- Counterfactual: B managed like A
- Saved onto the trade for the review
Sessions
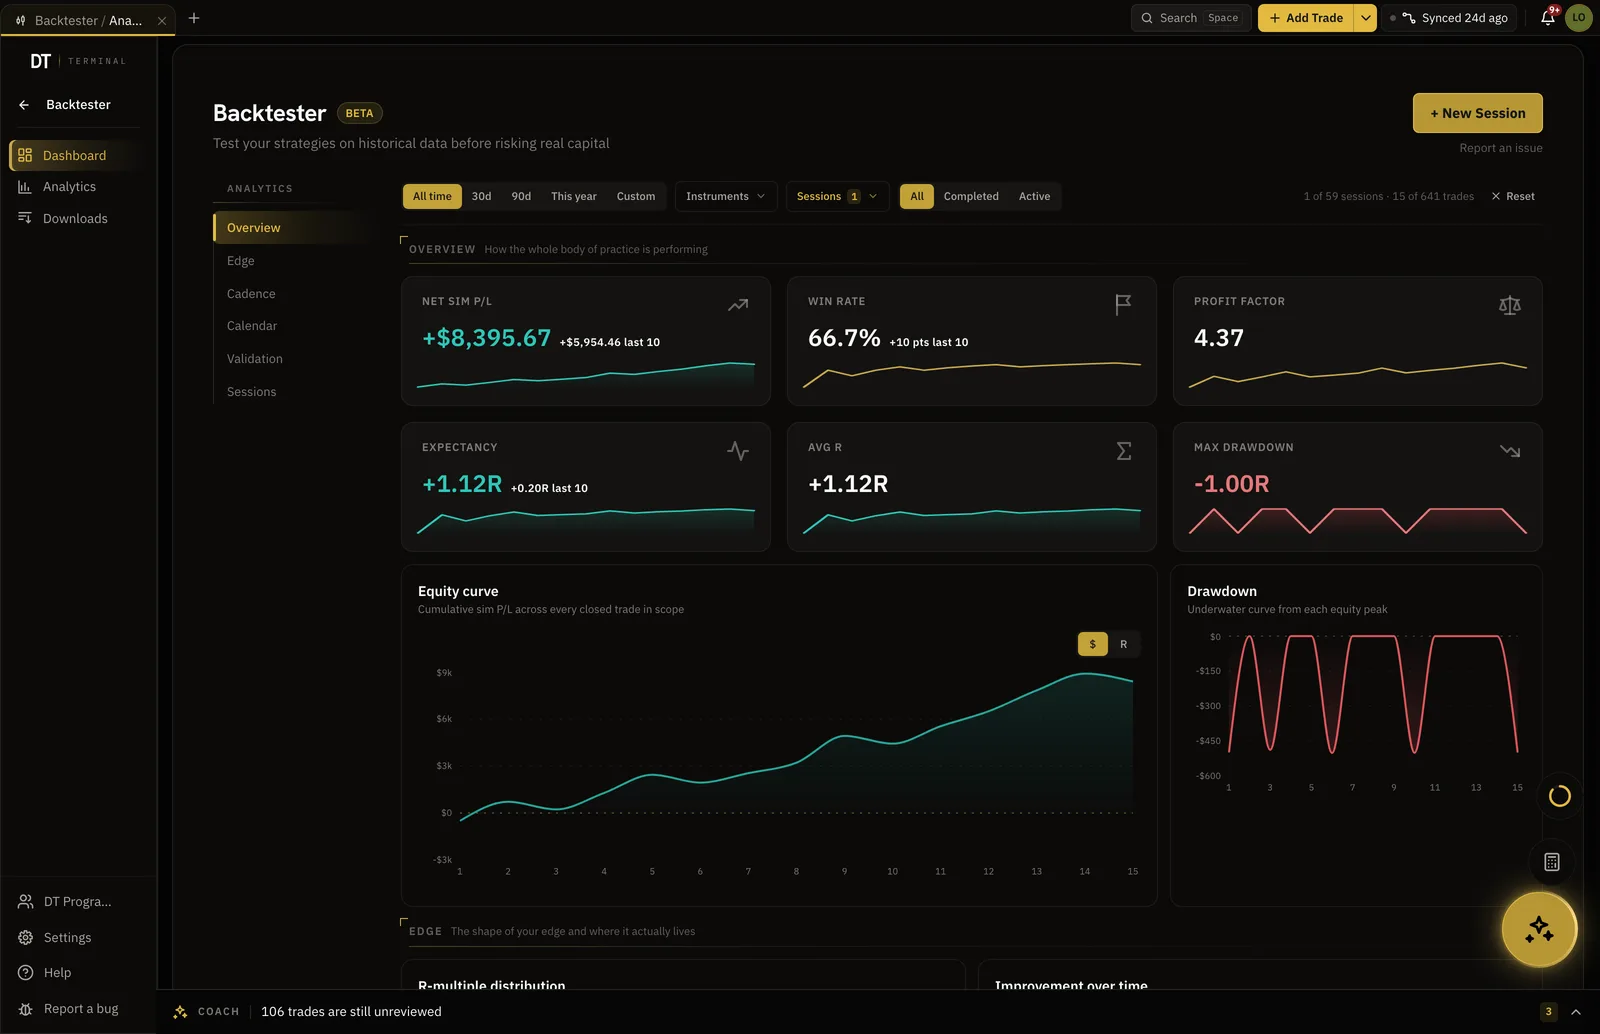
A backtest gets the same analytics.
Scope the numbers to one backtest session and read its P&L, win rate, expectancy and drawdown, so a tested idea is judged on the measures your live trading is judged on.
- Equity and drawdown, trade by trade
- Same measures as the live record
- Sessions and live trades in one journal
What is free
Basic insights are free.
The filters, the comparisons and the reports are Pro, $18 a month.
| Feature | Free | Pro |
|---|---|---|
| Basic performance insightsTrade count, average R:R, PnL chart | ||
| Detailed filtered trade stats | ||
| Strategy-level performance tracking | ||
| Exit OptimizerTested stop and target distances against your history | ||
| Edge Context while logging trades | ||
| Monthly performance reports | ||
| Advanced report comparisons |
Full comparison on the pricing page.
Questions
What analytics does a free account get?
Basic performance insights: trade count, average risk to reward and the P/L chart, over any date range and any instrument, on unlimited trades. Detailed filtered stats, the Exit Optimizer and reports are Pro, at $18 a month.
Can I filter by setup, session or account?
Yes, on Pro. Filter by multiple accounts, by tags in ANY or ALL mode and by strategy, and every number on the page recomputes for that slice. Date range and instrument filters are free.
What does the exit optimiser actually do?
It simulates stop, target and maximum holding time combinations against the trades you have already logged, and shows the highest scoring tested distances in your own sample. It reports what your record says, not what a market will do.
Do I get monthly reports?
On Pro. A monthly report covers performance, discipline and goals, exports to PDF and can be compared across months, quarters and years. Free accounts read the daily and weekly views.
Does this work on imported trades?
Yes. Anything in the log counts, whether it was typed, imported by CSV or synced from a broker, and backtest sessions are scored with the same measures.
Can I run DT Terminal from Claude?
Soon. We are building an MCP connector that opens the whole of DT Terminal to Claude: every workspace and every piece of your data, to read and to act on, with your consent per scope. It works with any assistant that speaks MCP, and it is in development, not live yet.
The record you already keep is the dataset.
Start free, log a month, and let the filters say which part of your trading pays.
Your privacy choices
Essential storage keeps DT Terminal working. Optional: product analytics and 60-day referral attribution. Change it any time in our Privacy Policy.